
Lihat juga


 16.10.2026 04:59 AM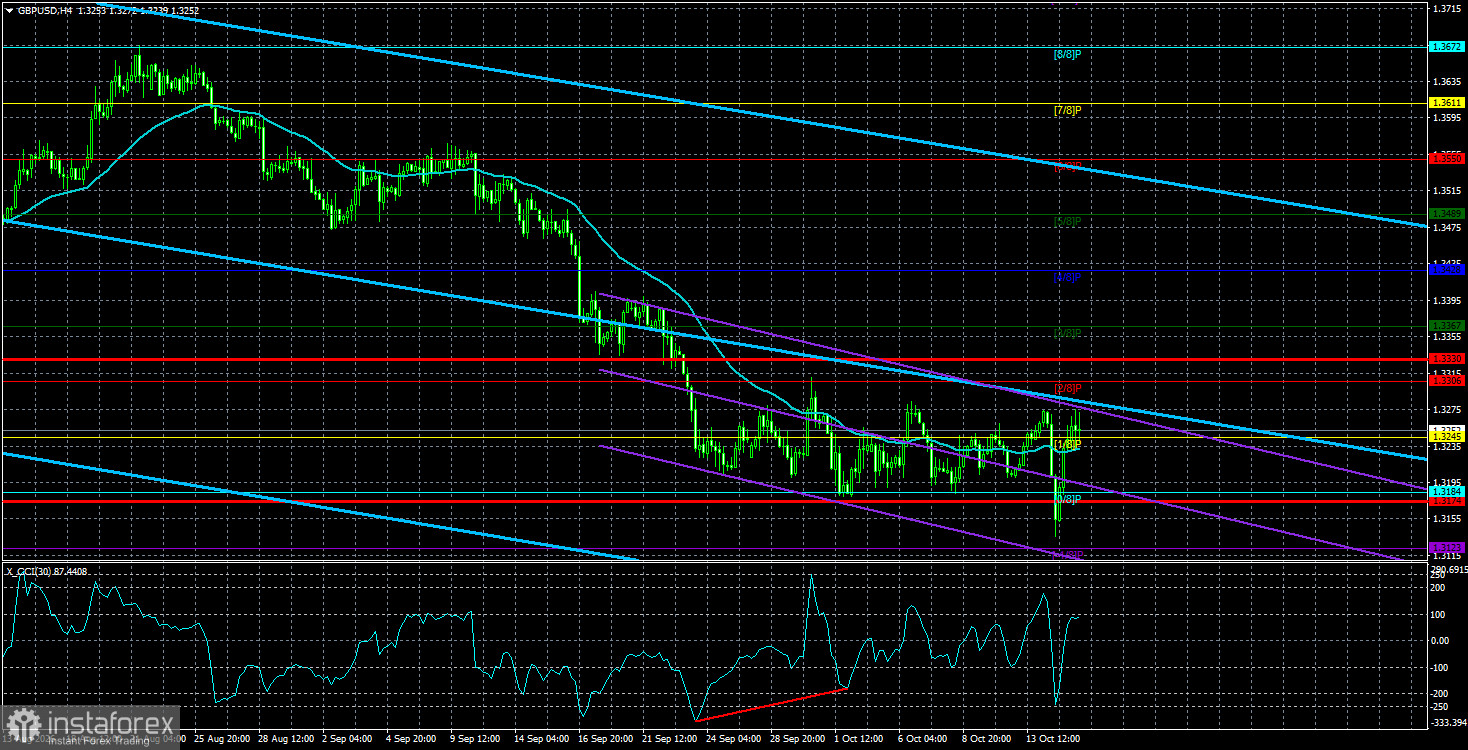
The GBP/USD currency pair posted a fairly strong rally on the fourth trading day of the week, the first reasonable move in the market in several weeks. The US dollar should begin a prolonged, powerful decline, driven by several factors rather than any single report. The US inflation report changed nothing about the Federal Reserve's plans or market expectations. So on what basis was the dollar supposed to have risen? We believe the situation is actually more complex than it appears at first glance.
First, we want to remind readers that the pound remains within sideways channels, at least on the daily and weekly timeframes. Yesterday's drop in the pair removed liquidity at the June 24 low. Thus, a deviation of the lower channel boundary occurred, which, by logic, should provoke a rise in the pound at least to the 1.3650 area. We should immediately note: anything can happen in the market. Even when all factors point one way, price can still move the other way. That happens because the market comprises a huge number of participants, and not all of them—or even those who do— make trading decisions based on fundamentals, macroeconomics, geopolitics, or technicals.
In other words, any news, pattern, technical signal, report, or event is merely a reason to think price will move in a given direction. How market makers — who manage tens or hundreds of billions — will behave at that moment is unknown to ordinary traders. So when we talk about illogical movement, we mean the news – market reaction link simply isn't working right now.
Thus the daily-timeframe flat is not canceled; the dollar's rise over the last month raises serious questions; the market still ignores even the most important pro-pound factors (for example, the Bank of England's readiness to begin tightening in early November and to raise rates roughly three times in total). So on what basis should we expect further dollar strength absent a correction? The market can keep buying the US currency—no one can stop it—but how long can the dollar keep rising without pause?
Our view remains unchanged. The US currency cannot continue rising based on the factors currently available to the market. If the GBP/USD decline continues, it will be as illogical as the prior move. As long as the daily-timeframe sideways channel remains in place, we do not consider a technical or speculative downtrend to be confirmed. We only remind you that a deviation from a channel boundary can be deep: price may fall further, take out stop losses, and then launch higher.
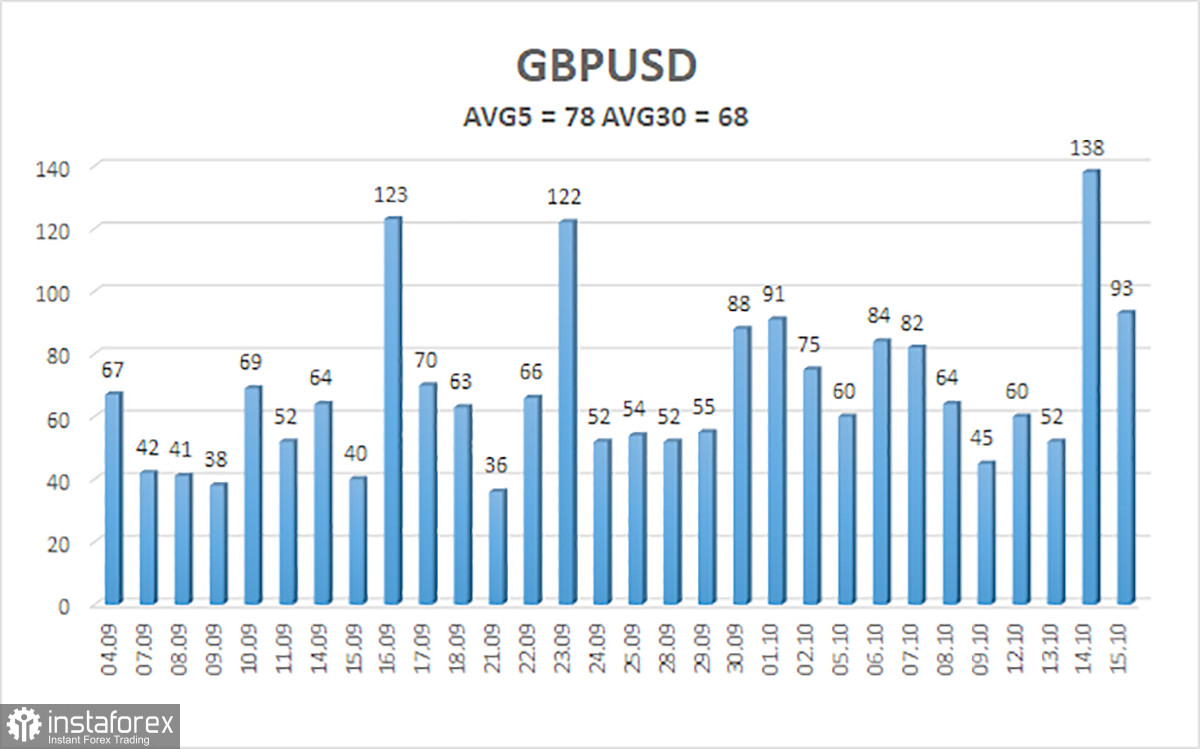
The average volatility of the GBP/USD pair over the last 5 trading days is 78 pips. For the pound/dollar pair, this value is considered "average." On Friday, October 16, we therefore expect movement inside a range bounded by 1.3174 and 1.3330. The higher linear-regression channel is turning down again. The CCI indicator entered the oversold area twice and also formed a "bullish" divergence, which warns of a possible end to the downtrend.
S1 – 1.3123
S2 – 1.3062
R1 – 1.3184
R2 – 1.3245
R3 – 1.3306
The GBP/USD currency pair continues its illogical downward move. Donald Trump's policies will continue to exert pressure on the US economy, so we do not expect long-term appreciation of the US dollar. The year 2026 so far has been favorable for the dollar due to geopolitics and inflation, which forced capital to seek safety and prompted the Fed to return to monetary tightening. However, on the weekly timeframe, a flat range between 1.3150 and 1.3780 persists within a four-year uptrend, supporting expectations for medium-term pound appreciation. Consider long positions with targets of 1.3367 and 1.3428 if price is above the moving average. If price is below the moving average, bearish trading is favored, with targets of 1.3174 and 1.3123. Be cautious with short positions, as price is at the lower boundary of the long-term sideways channel!


