
Veja também


 16.10.2026 08:16 AM
The four-hour (H4) chart for Crude Oil (#CL) shows a strong bullish breakout and significant price gains. Currently trading at 97.27, the price has clearly breached key resistance levels, maintaining upward momentum within established bullish channels.
Technical Analysis and Price Action
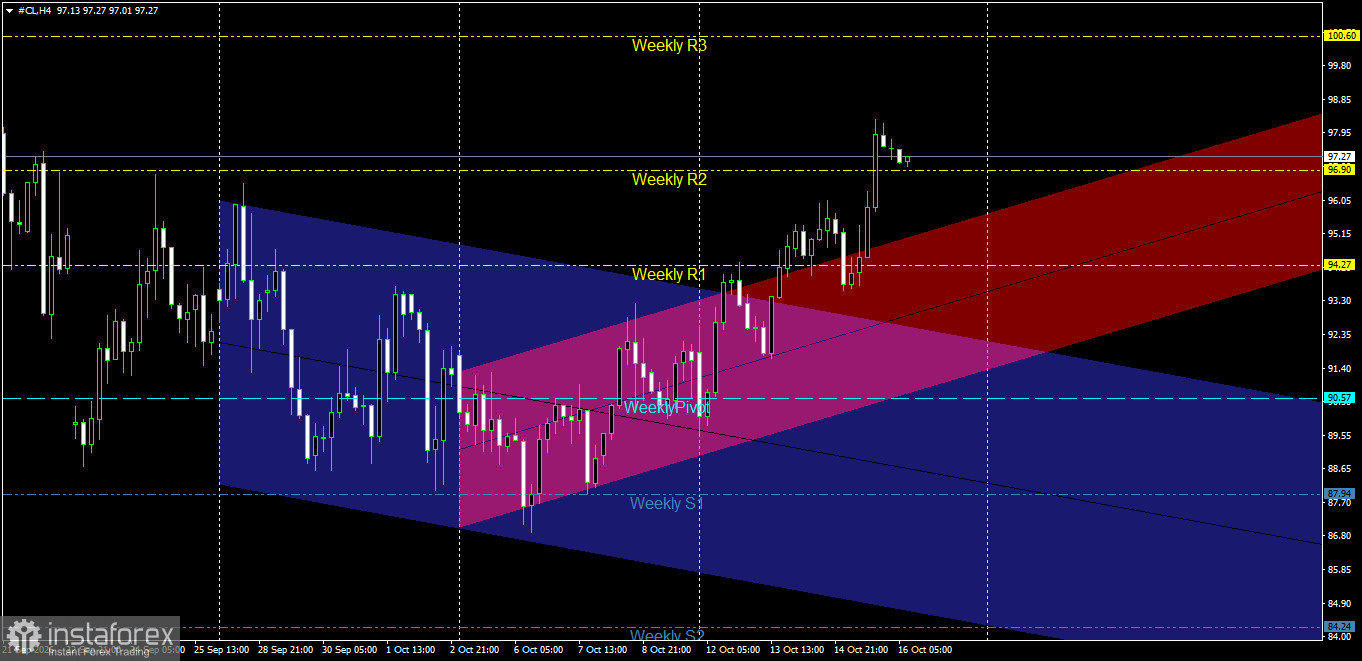
Price Channel Structure: The overall trend has shifted decisively from bearish to strongly bullish. The price has fully exited the previous downward channel and is now positioned within a primary bullish channel (in blue) and an accelerated sub-channel (in pink/red). The upward movement has intensified, with the price touching the upper boundaries of the sub-channel and surpassing previous highs—a clear sign of strong buying pressure.
Interaction with Pivot Levels: Crude Oil rallied from lows near the first weekly support (Weekly S1) at 87.94, moving past the weekly pivot point at 90.57. The sharp ascent continued, breaking through the first weekly resistance (Weekly R1) at 94.27, followed by a breach of the second weekly resistance (Weekly R2) at 96.90, as the asset eyes even higher levels.
Key Support and Resistance Levels
Major Resistance Levels:
First Resistance: 97.80 – 98.50 (new intraday highs and the upper boundary of the sub-channel). Second Resistance: 100.60 (Weekly R3).
Pivot Resistance: 102.00 and above (should the major bullish wave continue).
Key Support Levels:
First Support: 96.90 (formerly Weekly R2; currently acting as support).
Second Support: 94.27 (formerly Weekly R1).
Main Support: 90.57 (Weekly Pivot).
Price Action Outlook and Trading Recommendations
Bullish Scenario (Primary):
A positive trend strongly dominates the price action as long as trading remains above 96.90, and—more importantly—above the Weekly Pivot at 90.57.
Recommendation: Buy on any minor corrective pullback toward the support levels near 96.90, or upon stabilization above this level.
Technical Targets: 98.50 as an initial target, followed by an extension toward the third weekly resistance (Weekly R3) at 100.60.
Stop Loss: A 4-hour candle close below 95.50.
Bearish Corrective Scenario (Alternative):
This scenario is triggered if intense selling pressure emerges, leading to a breakdown below current support levels and a return to a position below 94.27.
Confirmation Condition: A break below 94.27, followed by a 4-hour candle close beneath that level. Technical objectives: To pave the way for a deeper downward correction, targeting a retest of the weekly pivot point at 90.57.
The daily timeframe chart for Crude Oil (#CL) shows notable positive performance and strong bullish momentum. The price is currently trading at 97.21, having achieved a clear and sustained breakout above key pivotal levels, while continuing its upward trajectory within established bullish price channels.
Technical Analysis and Price Action
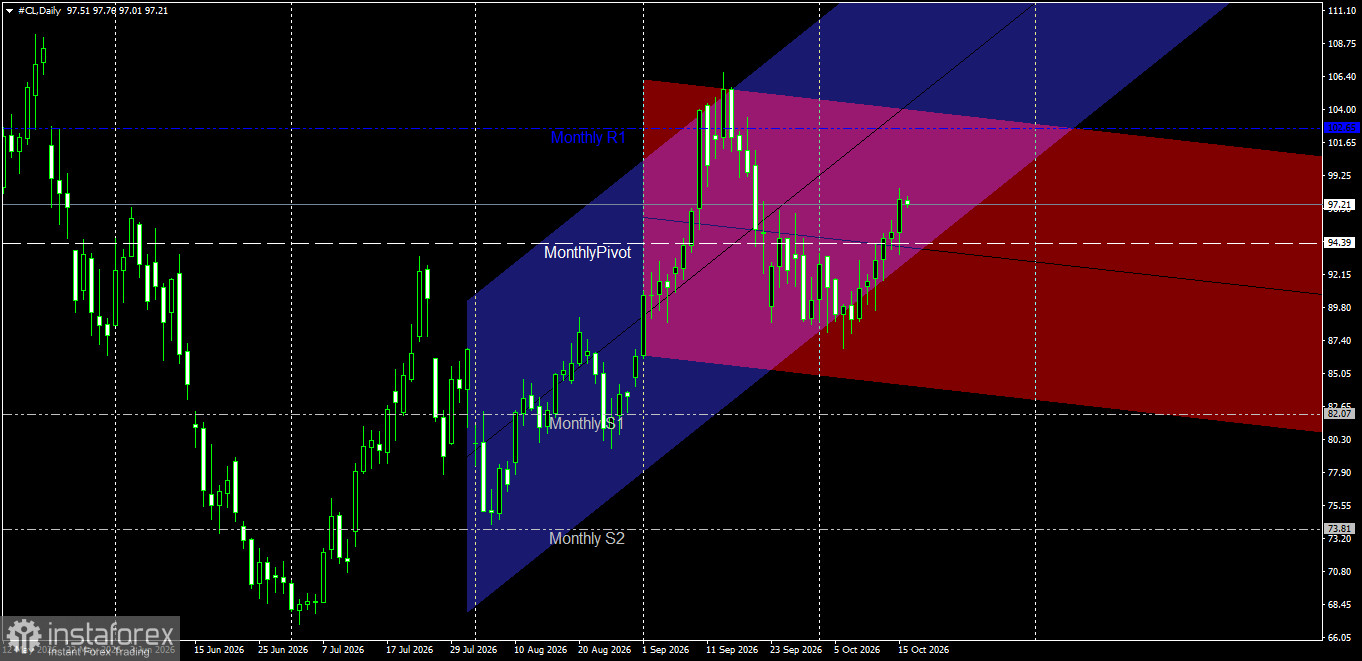
Price Channel Structure: Crude Oil is clearly moving within a broad, primary bullish channel (in blue) and an accelerated, secondary bullish channel (in pink/red). Following a corrective pullback, the price rebounded strongly from the channel's midline and the lower boundary of the secondary channel. It subsequently broke above the midline of the primary bullish channel and reached new highs, reflecting buyer dominance and robust medium-term bullish momentum.
Interaction with Monthly Pivot Levels: The price has successfully broken through and stabilized above the monthly pivot point at 94.39. This level, which previously served as a major resistance, has now transitioned into a solid support line, reinforcing the ongoing positive trend. Furthermore, the price is gradually approaching the next major resistance target: the first monthly resistance level (Monthly R1) at 102.65.
Key Support and Resistance Levels
Major Resistance Levels:
First Resistance: The 99.25 – 100.15 range (covering recent intraday highs and the upper boundary of the secondary channel). Second Resistance: 102.65 (Monthly R1).
Pivotal Resistance: 106.40 and above (the upper boundary of the primary ascending channel).
Key Support Levels:
First Support: 94.39 (Monthly Pivot and current pivotal support level).
Second Support: 82.07 (Monthly S1).
Major Support: 73.81 (Monthly S2 and the lower boundary of the primary channel).
Price Action Outlook and Trading Recommendations
Bullish Scenario (Primary):
A positive trend strongly dominates the daily timeframe as long as trading remains above the monthly pivot (94.39) and within the ascending channel.
Recommendation: Buy on any minor corrective pullback toward nearby support zones near 94.39, or upon stabilization above this level.
Technical Targets: 99.25 as an initial target, followed by an extension toward the first monthly resistance level at 102.65.
Stop Loss: A daily close below 93.00.
Bearish Corrective Scenario (Alternative):
This scenario is triggered if intense selling pressure emerges, leading to a downward break of the monthly pivot and a return below the 94.39 level.
Confirmation Condition: A daily close below 94.39. Technical Objectives: Paving the way for a deeper downward correction, targeting the 89.80 level, followed by the first monthly support level at 82.07.
Risk Management
Trading crude oil on a daily timeframe during periods of strong momentum requires strict adherence to rigorous capital management rules. Risk per trade should be limited to a maximum of 1% to 2%, and stop-loss orders must be carefully placed to protect the portfolio from the sharp volatility expected in energy markets.


