
Veja também


 09.10.2026 04:38 AM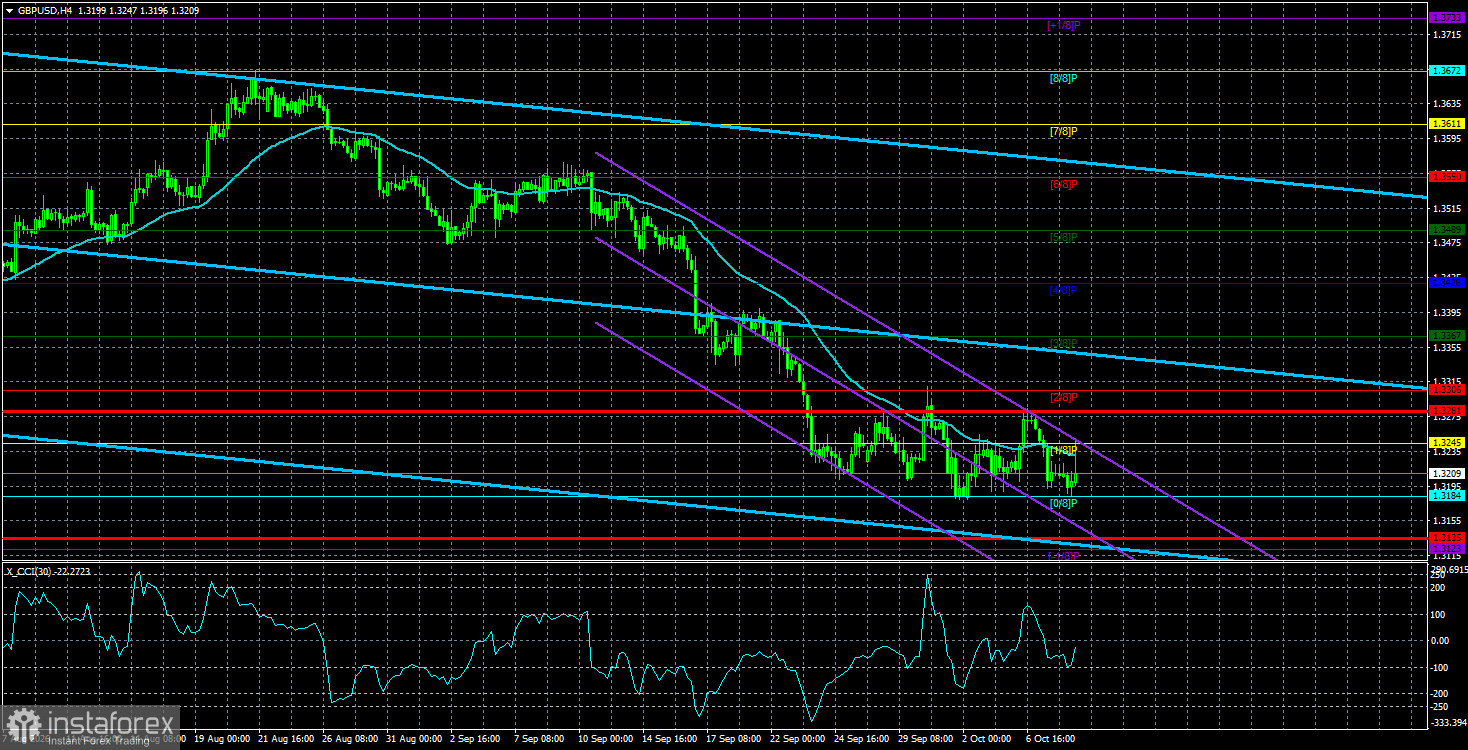
The GBP/USD pair on Thursday again tried to resume its decline and has found itself at a triple bottom. We believe the technical picture for the pound is not just interesting — it's almost epic. Sideways channels have formed simultaneously on three timeframes, and in each case price dropped to the lower boundary of those channels. In short, the channels belong to different scales and periods, but they share a common lower boundary around 1.3150–1.3180. That makes a resolution imminent.
We want to write that everything will be decided in the 1.3150–1.3180 area: price will either bounce there or break through and run away. But markets rarely behave exactly like textbook examples. It would be unwise to focus solely on that zone. Yes, a bounce is possible, and a rally in the pound would be logical on virtually every parameter and factor. But price may also sweep liquidity from a series of lows clustered around that area — lows formed both in recent days and over the past year. You can see this clearly on weekly, daily, and hourly charts. The 4-hour chart is the least informative right now.
So what should we expect from GBP/USD? If we insist on any logic, it points to upside. We forecast further pound strength earlier this year, and absent the U.S.- Middle East shocks, that view would likely have played out. Unfortunately, "black swans" have arrived — first one, then another — and at this rate they could come in flocks. If the U.S. launches a new war tomorrow, who on the market can predict it? If tomorrow the U.S. signs a deal with Iran, how could anyone foresee that given the day-to-day shifts in rhetoric?
Therefore, our base case remains unchanged—long-term pound appreciation. In the near term, we would expect a rise at least to 1.3650 (the upper boundary of the daily sideways channel). However, price may reverse at the June 24 low near 1.3139, sweep liquidity below it, and drop to 1.3100. Slightly lower are two more lows at 1.3037 and 1.3009, from which price could also sweep liquidity. In other words, even after a month of decline and despite no clear reasons for further falls, the pair can still move another ~200 pips lower. Therefore, according to our scenario, long positions should be accumulated in the 1.3000–1.3180 range. Trying to catch a single exact reversal point will probably fail.
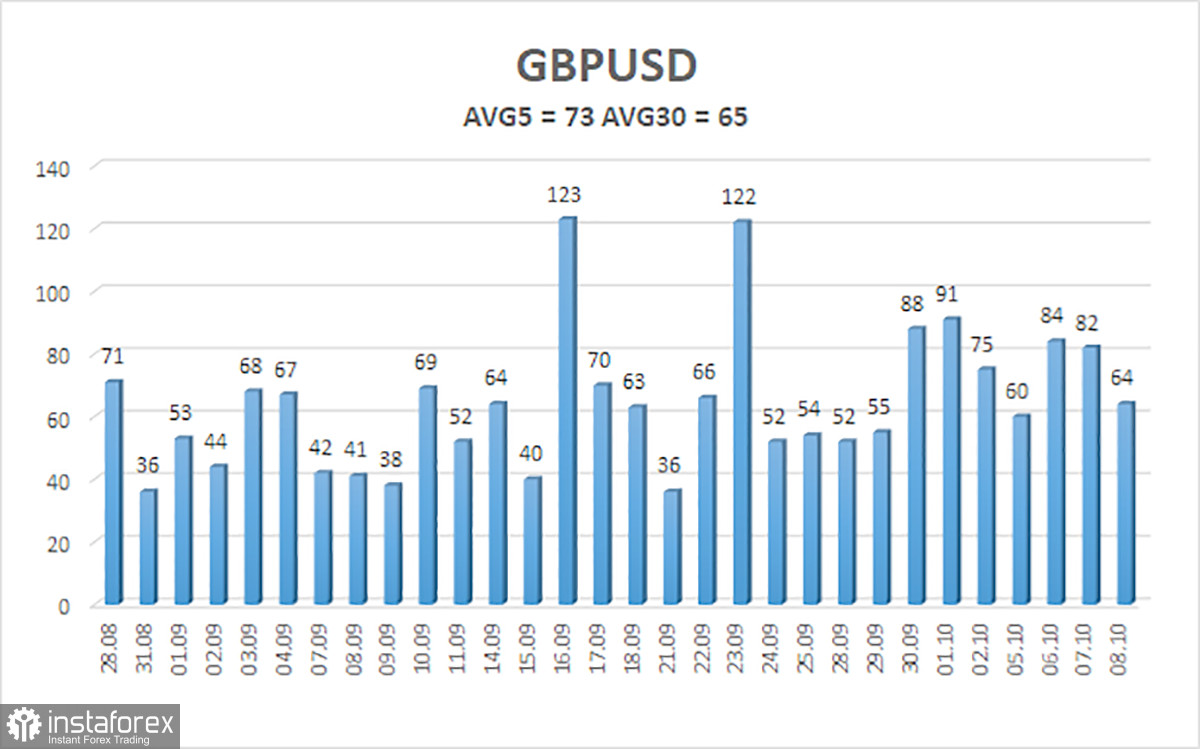
The average volatility of the GBP/USD pair over the last 5 trading days as of October 8 is 79 pips, which is "average." We expect the pair to move within the range bounded by 1.3129 and 1.3287 on Thursday, October 8. The longer-term linear-regression channel has turned down again. The CCI indicator has already entered the oversold area twice, warning of a possible end to the downward trend.
S1 – 1.3184
S2 – 1.3123
S3 – 1.3062
R1 – 1.3245
R2 – 1.3306
R3 – 1.3367
The GBP/USD currency pair continues its illogical downward movement. Donald Trump's policies will continue to put pressure on the US economy, so we do not expect the US dollar to strengthen in the long term. So far, 2026 has been positive for the dollar due to geopolitical risk and inflation, which forced capital into safety and prompted the Fed to return to monetary tightening. However, on the weekly timeframe, a flat range persists between 1.3150 and 1.3780 within a four-year uptrend, supporting the case for medium-term pound appreciation. Consider long positions with targets of 1.3367 and 1.3428 when price is above the moving average. Price below the moving average allows trading to the downside with targets of 1.3184 and 1.3135. Be cautious with short positions, as price is currently near the lower boundary of the long-term sideways channel.


